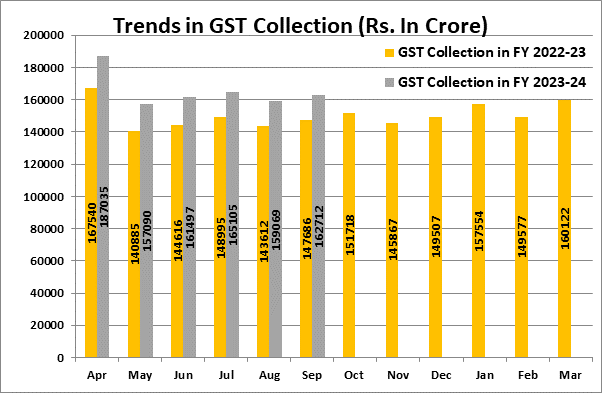
₹1,62,712 crore gross GST revenue collected during September 2023; records 10% Year-on-Year growth
GST collection crosses ₹1.60 lakh crore mark for the fourth time in FY 2023-24 ₹9,92,508 crore gross GST collection for the first half of FY 2023-24 marks 11% Y-o-Y growth Average monthly gross GST collection in FY 2023-24 at Rs. 1.65 lakh crore with 11% Y-o-Y growth
The gross GST revenue collected in the month of September, 2023 is ₹1,62,712 crore out of which CGST is ₹29,818 crore, SGST is ₹37,657 crore, IGST is ₹83,623 crore (including ₹41,145 crore collected on import of goods) and cess is ₹11,613 crore (including ₹881 crore collected on import of goods).
The government has settled ₹33,736 crore to CGST and ₹27,578 crore to SGST from IGST. The total revenue of Centre and the States in the month of September, 2023 after regular settlement is ₹63,555 crore for CGST and ₹65,235 crore for the SGST.

The revenues for the month of September, 2023 are 10% higher than the GST revenues in the same month last year. During the month, the revenues from domestic transactions (including import of services) are 14% higher than the revenues from these sources during the same month last year. It is for the fourth time that the gross GST collection has crossed ₹1.60 lakh crore mark in FY 2023-24.
The gross GST collection for the first half of the FY 2023-24 ending September, 2023 [₹9,92,508 crore] is 11% higher than the gross GST collection in the first half of FY 2022-23 [₹8,93,334 crore]. The average monthly gross collection in FY 2023-24 is ₹1.65 lakh crore, which is 11% higher than average monthly gross collection for first half of FY 2022-23 where it was ₹1.49 lakh crore.
The chart below shows trends in monthly gross GST revenues during the current year. Table-1 shows the state-wise figures of GST collected in each State during the month of September 2023 as compared to September 2022. Table-2 shows the state-wise figures of post settlement GST revenue of each State till the month of September 2023.
Chart: Trends in GST Collection

State-wise growth of GST Revenues during September, 2023
|
State/UT |
Sep-22 |
Sep-23 |
Growth (%) |
|
Jammu and Kashmir |
428 |
563 |
32% |
|
Himachal Pradesh |
712 |
784 |
10% |
|
Punjab |
1,710 |
1,866 |
9% |
|
Chandigarh |
206 |
219 |
6% |
|
Uttarakhand |
1,300 |
1,392 |
7% |
|
Haryana |
7,403 |
8,009 |
8% |
|
Delhi |
4,741 |
4,849 |
2% |
|
Rajasthan |
3,307 |
3,869 |
17% |
|
Uttar Pradesh |
7,004 |
7,844 |
12% |
|
Bihar |
1,466 |
1,397 |
-5% |
|
Sikkim |
285 |
315 |
11% |
|
Arunachal Pradesh |
64 |
81 |
27% |
|
Nagaland |
49 |
52 |
5% |
|
Manipur |
38 |
56 |
47% |
|
Mizoram |
24 |
27 |
14% |
|
Tripura |
65 |
73 |
13% |
|
Meghalaya |
161 |
165 |
2% |
|
Assam |
1,157 |
1,175 |
2% |
|
West Bengal |
4,804 |
4,940 |
3% |
|
Jharkhand |
2,463 |
2,623 |
7% |
|
Odisha |
3,765 |
4,249 |
13% |
|
Chhattisgarh |
2,269 |
2,684 |
18% |
|
Madhya Pradesh |
2,711 |
3,118 |
15% |
|
Gujarat |
9,020 |
10,129 |
12% |
|
Dadra and Nagar Haveli and Daman & Diu |
312 |
350 |
12% |
|
Maharashtra |
21,403 |
25,137 |
17% |
|
Karnataka |
9,760 |
11,693 |
20% |
|
Goa |
429 |
497 |
16% |
|
Lakshadweep |
3 |
2 |
-45% |
|
Kerala |
2,246 |
2,505 |
12% |
|
Tamil Nadu |
8,637 |
10,481 |
21% |
|
Puducherry |
188 |
197 |
5% |
|
Andaman and Nicobar Islands |
33 |
23 |
-30% |
|
Telangana |
3,915 |
5,226 |
33% |
|
Andhra Pradesh |
3,132 |
3,658 |
17% |
|
Ladakh |
19 |
35 |
81% |
|
Other Territory |
202 |
207 |
2% |
|
Center Jurisdiction |
182 |
196 |
8% |
|
Grand Total |
1,05,615 |
1,20,686 |
14% |
Table-2: SGST & SGST portion of IGST settled to States/UTs
April-September (Rs. in crore)
|
Pre-Settlement SGST |
Post-Settlement SGST |
|||||
|
State/UT |
2022-23 |
2023-24 |
Growth |
2022-23 |
2023-24 |
Growth |
|
Jammu and Kashmir |
1,138 |
1,515 |
33% |
3,546 |
4,102 |
16% |
|
Himachal Pradesh |
1,150 |
1,314 |
14% |
2,770 |
2,778 |
0% |
|
Punjab |
3,846 |
4,216 |
10% |
9,215 |
10,869 |
18% |
|
Chandigarh |
300 |
335 |
12% |
1,002 |
1,147 |
15% |
|
Uttarakhand |
2,401 |
2,589 |
8% |
3,708 |
4,055 |
9% |
|
Haryana |
9,045 |
9,864 |
9% |
14,948 |
17,161 |
15% |
|
Delhi |
6,872 |
7,639 |
11% |
13,746 |
15,660 |
14% |
|
Rajasthan |
7,597 |
8,488 |
12% |
16,461 |
19,129 |
16% |
|
Uttar Pradesh |
13,711 |
16,069 |
17% |
32,540 |
36,109 |
11% |
|
Bihar |
3,567 |
4,092 |
15% |
11,497 |
12,679 |
10% |
|
Sikkim |
153 |
267 |
75% |
406 |
545 |
34% |
|
Arunachal Pradesh |
253 |
343 |
35% |
807 |
1,013 |
26% |
|
Nagaland |
108 |
155 |
43% |
474 |
539 |
14% |
|
Manipur |
143 |
177 |
24% |
681 |
566 |
-17% |
|
Mizoram |
93 |
147 |
58% |
419 |
491 |
17% |
|
Tripura |
206 |
258 |
25% |
696 |
790 |
13% |
|
Meghalaya |
227 |
311 |
37% |
711 |
860 |
21% |
|
Assam |
2,562 |
2,906 |
13% |
5,965 |
7,181 |
20% |
|
West Bengal |
10,751 |
11,960 |
11% |
18,786 |
20,949 |
12% |
|
Jharkhand |
3,661 |
4,462 |
22% |
5,352 |
6,043 |
13% |
|
Odisha |
7,206 |
8,068 |
12% |
9,096 |
10,869 |
19% |
|
Chhattisgarh |
3,720 |
4,136 |
11% |
5,292 |
6,454 |
22% |
|
Madhya Pradesh |
5,221 |
6,324 |
21% |
12,768 |
15,350 |
20% |
|
Gujarat |
18,628 |
20,839 |
12% |
27,226 |
31,106 |
14% |
|
Dadra and Nagar Haveli and Daman and Diu |
330 |
315 |
-5% |
566 |
508 |
-10% |
|
Maharashtra |
42,043 |
50,062 |
19% |
62,010 |
72,741 |
17% |
|
Karnataka |
17,196 |
20,097 |
17% |
31,076 |
36,162 |
16% |
|
Goa |
957 |
1,109 |
16% |
1,678 |
1,940 |
16% |
|
Lakshadweep |
5 |
14 |
192% |
16 |
60 |
283% |
|
Kerala |
6,014 |
6,986 |
16% |
14,594 |
15,827 |
8% |
|
Tamil Nadu |
17,712 |
20,158 |
14% |
28,345 |
31,778 |
12% |
|
Puducherry |
233 |
246 |
6% |
580 |
727 |
25% |
|
Andaman and Nicobar Islands |
101 |
111 |
10% |
247 |
271 |
10% |
|
Telangana |
8,184 |
9,790 |
20% |
17,685 |
20,023 |
13% |
|
Andhra Pradesh |
6,298 |
7,028 |
12% |
13,496 |
15,390 |
14% |
|
Ladakh |
63 |
98 |
55% |
245 |
300 |
23% |
|
Other Territory |
78 |
118 |
52% |
241 |
542 |
125% |
|
Grand Total |
2,01,771 |
2,32,606 |
15% |
3,68,888 |
4,22,713 |
15% |


 CAclubindia

