₹ 1,43,612 crore gross GST revenue collected in the month of August 2022
Revenues for the month of August 2022 28% higher than the GST revenues in the same month in 2021
Monthly GST revenues more than the ₹ 1.4 lakh crore for six months in a row
The gross GST revenue collected in the month of August 2022 is
₹ 1,43,612 crore of which CGST is ₹ 24,710 crore, SGST is ₹ 30,951 crore, IGST is
₹ 77,782 crore (including ₹ 42,067 crore collected on import of goods) and cess is
₹ 10,168 crore (including ₹ 1,018 crore collected on import of goods).
The government has settled ₹ 29,524 crore to CGST and ₹ 25,119 crore to SGST from IGST. The total revenue of Centre and the States in the month of August 2022 after regular settlement is ₹ 54,234 crore for CGST and ₹ 56,070 crore for the SGST.

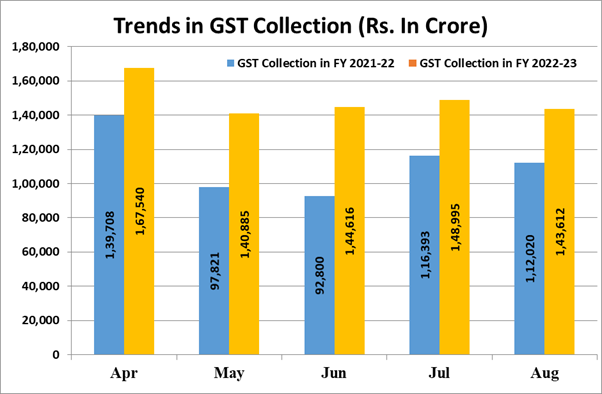
The revenues for the month of August 2022 are 28% higher than the GST revenues in the same month last year of ₹ 1,12,020 crore. During the month, revenues from import of goods was 57% higher and the revenues from domestic transaction (including import of services) are 19% higher than the revenues from these sources during the same month last year.
For six months in a row now, the monthly GST revenues have been more than the ₹ 1.4 lakh crore mark. The growth in GST revenue till August 2022 over the same period last year is 33%, continuing to display very high buoyancy. This is a clear impact of various measures taken by the Council in the past to ensure better compliance. Better reporting coupled with economic recovery has been having positive impact on the GST revenues on a consistent basis. During the month of July 2022, 7.6 crore e-way bills were generated, which was marginally higher than 7.4 crore in June 2022 and 19% higher than 6.4 crore in June 2021.
The chart below shows trends in monthly gross GST revenues during the current year. The table shows the state-wise figures of GST collected in each State during the month of August 2022 as compared to August 2021.

State-wise growth of GST Revenues during August 2022
|
State |
Aug-21 |
Aug-22 |
Growth |
|
Jammu and Kashmir |
392 |
434 |
11% |
|
Himachal Pradesh |
704 |
709 |
1% |
|
Punjab |
1,414 |
1,651 |
17% |
|
Chandigarh |
144 |
179 |
24% |
|
Uttarakhand |
1,089 |
1,094 |
0% |
|
Haryana |
5,618 |
6,772 |
21% |
|
Delhi |
3,605 |
4,349 |
21% |
|
Rajasthan |
3,049 |
3,341 |
10% |
|
Uttar Pradesh |
5,946 |
6,781 |
14% |
|
Bihar |
1,037 |
1,271 |
23% |
|
Sikkim |
219 |
247 |
13% |
|
Arunachal Pradesh |
53 |
59 |
11% |
|
Nagaland |
32 |
38 |
18% |
|
Manipur |
45 |
35 |
-22% |
|
Mizoram |
16 |
28 |
78% |
|
Tripura |
56 |
56 |
0% |
|
Meghalaya |
119 |
147 |
23% |
|
Assam |
959 |
1,055 |
10% |
|
West Bengal |
3,678 |
4,600 |
25% |
|
Jharkhand |
2,166 |
2,595 |
20% |
|
Odisha |
3,317 |
3,884 |
17% |
|
Chhattisgarh |
2,391 |
2,442 |
2% |
|
Madhya Pradesh |
2,438 |
2,814 |
15% |
|
Gujarat |
7,556 |
8,684 |
15% |
|
Daman and Diu |
1 |
1 |
4% |
|
Dadra and Nagar Haveli |
254 |
310 |
22% |
|
Maharashtra |
15,175 |
18,863 |
24% |
|
Karnataka |
7,429 |
9,583 |
29% |
|
Goa |
285 |
376 |
32% |
|
Lakshadweep |
1 |
0 |
-73% |
|
Kerala |
1,612 |
2,036 |
26% |
|
Tamil Nadu |
7,060 |
8,386 |
19% |
|
Puducherry |
156 |
200 |
28% |
|
Andaman and Nicobar Islands |
20 |
16 |
-21% |
|
Telangana |
3,526 |
3,871 |
10% |
|
Andhra Pradesh |
2,591 |
3,173 |
22% |
|
Ladakh |
14 |
19 |
34% |
|
Other Territory |
109 |
224 |
106% |
|
Center Jurisdiction |
214 |
205 |
-4% |
|
Grand Total |
84,490 |
1,00,526 |
19% |
1]Does not include GST on import of goods


 CAclubindia

