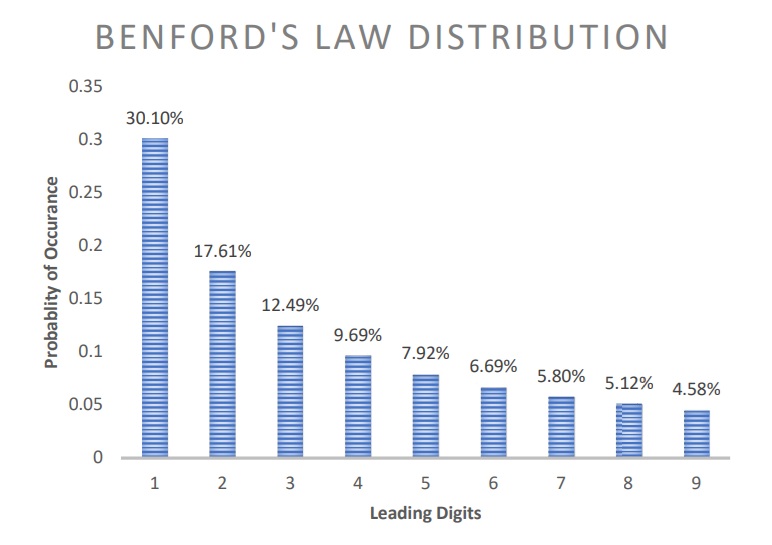

Benford’s Law posits that the distribution of leading digits1 (0-9) in a large dataset follows a logarithmic pattern, with the digit ‘1’ being the most prevalent.
Widely used in fraud detection and forensic accounting, Benford’s Law provides a baseline for expected digit frequencies.
However, given the inherent differences in the nature of financial data across sectors, this research explores how Benford’s Law behaves in various sector categories.
The discovery of Benford’s Law, an intriguing mathematical phenomenon, traces its roots to a time before the advent of calculators, when intricate arithmetic was entrusted to reference books known as logarithm tables.
Remarkably, Frank Benford was not the first to stumble upon this law; its origins can be attributed to the astute observations of astronomer Simon Newcomb in 1881.
Newcomb noticed something odd while looking at logarithm tables (commonly referred to as the ‘log book’ in modern times).
He saw that the first pages, which showed numbers starting with ‘1,’ looked more worn out and dirty than the later pages. This led him to deduce that smaller leading digits were more prevalent in natural data sets, and he meticulously published the correct percentages.
Fast forward to 1938, when physicist Frank Benford independently made a parallel observation and significantly contributed to popularizing what would later be known as Benford’s Law.
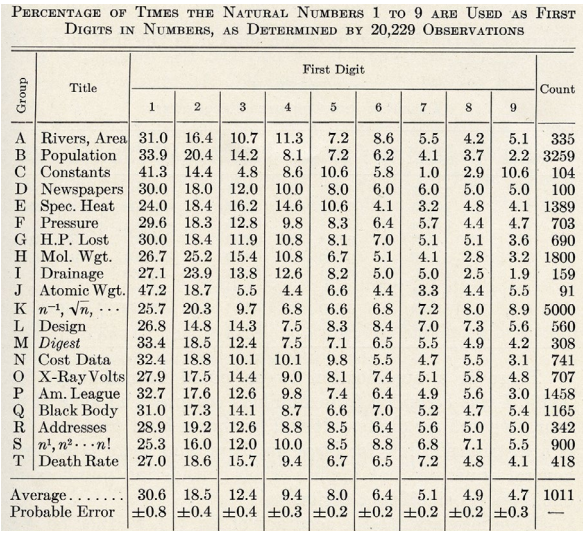
Benford’s dedication to this phenomenon extended to the compilation of an extensive dataset comprising over 20,000 data points, showcasing the universality of this mathematical principle.
Use of Benford’s Law in Forensic Accounting
In a ground-breaking doctoral thesis by Nigrini in 1992, titled “The detection of income tax evasion through an analysis of digital distribution”, the application of Benford’s Law to cases of tax evasion was pioneered.
In June 1993, Nigrini published his first article on Benford’s Law, consisting of only two pages, in The Balance Sheet, the journal of the Investigative and Forensic Accounting Interest Group of the Canadian Institute of Chartered Accountants.
He made a somewhat daring prophecy on the subject of analysis of digital frequencies, namely that Benford’s Law could be used in fraud detection (Nigrini, 1994:3).1
The study was based on the suggestion that “individuals, either through psychological habits or other constraints peculiar to the situation, will invent fraudulent numbers that will not adhere to the expected digit frequencies”.
Nigrini encouraged others to see that Benford’s Law is much more than just a mathematical frivolity. Over the past years, Nigrini has turned out to be the driving force behind a far from light-hearted use of the Law: fraud detection (Matthews, 1999:29).
Limitations of Benford’s Law
Bhattacharya and Kumar (2008:150) add that, although Benford’s Law has been utilised in other divisions of forensic science, forensic accounting using Benford’s Law and other data mining tools is still in the early phases.
The major concern regarding Benford’s Law, according to Albrecht (2008), is that corporate data do not follow natural patterns all the time.
There are many reasons as to why transactions may not conform to the expected distributions of Benford’s Law such as unusual business cycles, recurring fixed expenses, and assigned amounts.
In order for Benford’s Law to be applicable to numeric data sets, the following criteria must be met: the transactions should assess the same phenomenon; no built-in minimum or maximum values should be present in the data set; numbers should not be assigned; and the data set should be large enough for the Benford distribution to emerge.
In addition, Benford’s Law will not be successful where no transaction has been recorded, for example, kickbacks. It is important to bear in mind that not all deviations from the Benford distribution are due to fraud; they can be attributed to false positives.
Benford’s Law in Retailing Sector
The five sample companies have the following market capitalisation.
| Retailing Sector | Market Cap (Rs. in crores) |
|---|---|
| Avenue SuperMarts Ltd. | 239,183.45 |
| Trent | 135,158.11 |
| Shoppers Stop | 8,071.39 |
| V Mart Retail | 4,142.71 |
| Future Markets Network | 48.05 |
There were a total of 3622 numbers counted across 3 statements across the five companies. The maximum count of numbers was with leading digit of 1 (1101 numbers). And the least occurring figure was with the leading digit 9 (only 156 numbers).
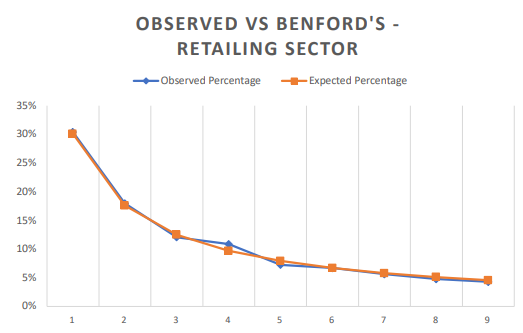
The highest anomality is spotted in the leading digit 4 which has the highest absolute variance of 0.01186967, indicating a notable overrepresentation of the digit ‘4.’.
The absolute variation for the leading digit ‘6’ is minimal (0.00014322), suggesting a very close alignment between the observed (0.06709001) and expected (0.06694679) probabilities for this digit.