EU has cut down its interest rates and now all eyes on US Fed, but more than the rate cut the biggest question within the mind of every investors either in India or outside is that how much more allocation should be made to S&P 500 keeping the current AI Euphoria in mind.
The year 2024 has already proven to be one for the record books, with the S&P 500 hitting 24 all-time highs, marking the second-best streak in 24 years for the first five months. Surpassing only by the index's performance in 2021, which boasted 26 new records, this year's surge has been notably driven by the communication services and IT sectors, which have seen gains of 20% and 17%, respectively, year-to-date. Additionally, utilities have surged by 14%, fueled by investors' optimism regarding increased demand for data centers amidst the AI fever.

The S&P 500's market capitalization has soared by an astonishing $12 trillion since October, accounting for roughly 40% of GDP. As Warren Buffett famously remarked, "The stock market is a device for transferring money from the impatient to the patient." With such impressive gains, investors may question whether it's an opportune time to enter the S&P 500.

Indeed, the index has just marked its 26th all-time high of the year, alongside achieving its second-best five-month streak in over two decades. Further since the start of the year, the S&P 500 has added approximately $5 trillion in market capitalization. Moreover, since its low in October 2023, the index has surged by around 30%, adding over $10.5 trillion in market cap. This remarkable performance has been largely spearheaded by big tech, underscoring one of the strongest runs in stock market history. The most important part to notice is that the stock market appears to be stronger than ever, with 62% of US adults now invested, marking the highest percentage since 2007.
This figure reflects a slight increase from 2023 and a notable 7 percentage point rise since 2020. Across income brackets, ownership of stocks is particularly prevalent among households earning over $100,000 annually, with 87% invested. However, ownership drops significantly to just 25% among households earning $40,000 or less per year. Intriguingly, the middle class is heavily invested, with 65% participating in the stock market.
The small-cap & Penny Stock SAGA
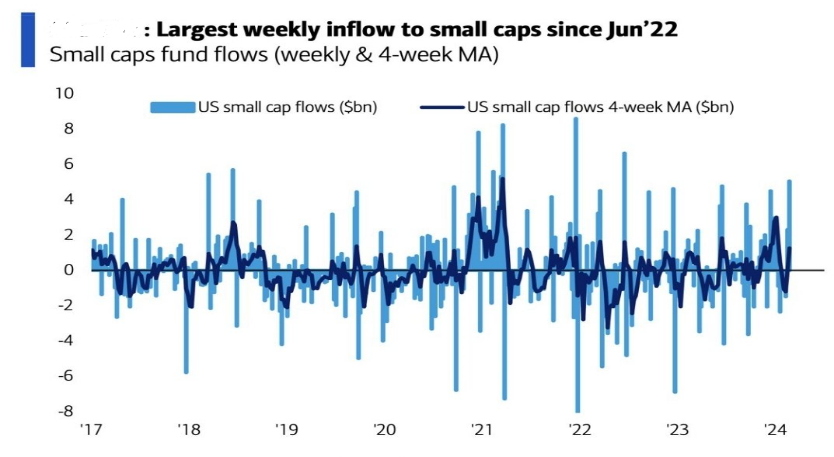
Despite the soaring heights reached by the large-cap US indices, such as the Nasdaq 100 and the S&P 500, the mid-cap S&P 400 and small-cap S&P 600 encountered a challenging week. Small caps have shown continued weakness, with the iShares Russell 2000 ETF (IWM) declining by 2.87% in recent days. Notably, the Russell 2000 has experienced over 600 consecutive days of being down by 10% or more from its all-time high.


In contrast to the large-cap indices, US stocks, when adjusted for inflation and relative to GDP, have yet to reclaim their 2021 highs. Additionally, the Russell 2000 to S&P 500 ratio currently sits at its lowest level since October 2001, indicating that small caps are the most undervalued relative to large caps in 23 years. While the S&P 500 has surged by 178% over the last decade, outpacing the Russell 2000's gain of 108%, small caps have only seen a modest 2% increase year-to-date compared to the S&P 500's 12% surge. This begs the question: are small caps undervalued, or are large caps overvalued? Could the gap between them narrow in the months ahead? Well that depends on the interest rates coming down and having a positive impact on the earnings from the demand side.
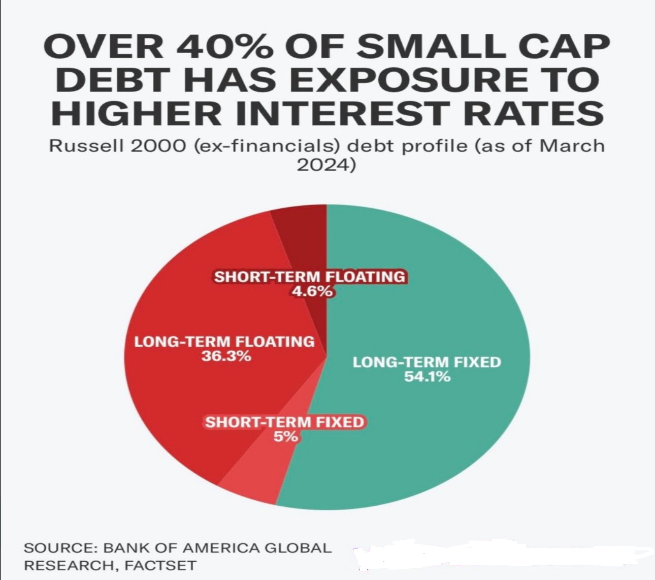
A significant portion of small-cap debt is tied to floating rates, making them particularly sensitive to interest rate fluctuations. With rates rising from zero to five percent since 2022, small-cap interest payments have skyrocketed. Unless investors anticipate a substantial recession and anticipate the Fed to slash interest rates by at least 300 basis points, small caps may not appear attractive.
The ratio of the S&P 500 ETF ($SPY) to a popular bond-tracking ETF ($TLT) has quadrupled in the past four years, indicating a significant shift in favor of stocks over bonds. This outperformance of US stocks relative to bonds is the largest seen in over two decades, highlighting investors' preference for equities.
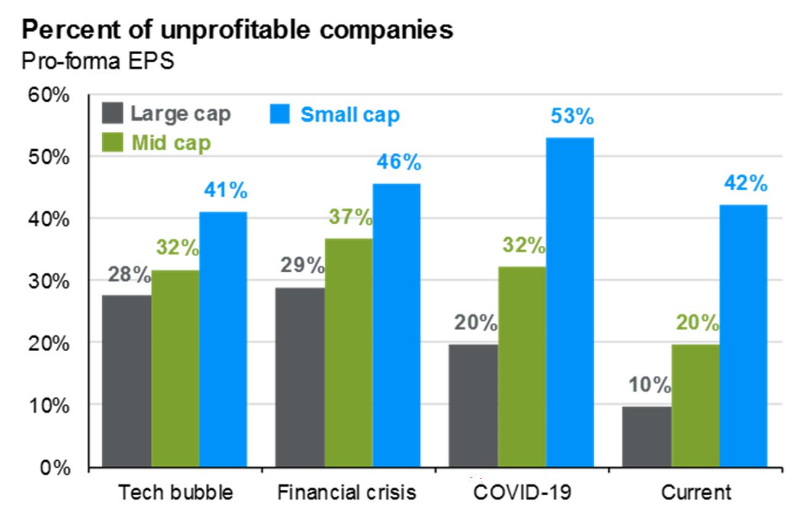
Penny stock trading has surged in popularity, with trading volumes of US stocks priced under $1 accounting for approximately 14% of the total market volume. This share has more than tripled in just five years, reaching a record high. In fact, seven of the top ten most traded US stocks in May were penny stocks, none of which were profitable companies.
Despite the overall market exuberance, corporate bankruptcies have been on the rise, with the US witnessing 210 corporate bankruptcies in the first four months of 2024, the second-highest number since 2012. In April alone, S&P Global recorded 66 new bankruptcy filings, up from 61 in March, with the consumer discretionary and healthcare sectors being the hardest hit. The prolonged period of higher rates is beginning to take its toll on US corporates.
The Phenomenon of the Magnificent 7: Dominating the Market's Spotlight
In 2024, the stocks of Amazon, Apple, Microsoft, Google, and Nvidia have surged by an impressive 27% year-to-date, driving much of the S&P 500's 11% gain for the same period. In contrast, the remaining 495 companies in the index have experienced a more modest 6% increase. Moreover, the equal-weighted S&P 500 index has seen a mere 5% uptick this year. Currently, these six largest components collectively represent a record-breaking ~30% of the S&P 500 index.
The discrepancy between the equal-weighted S&P 500 and the traditional index is striking, with the former dropping to its lowest level since March 2009. While the S&P 500 has surged by approximately 10% this year, the equal-weighted index has only managed a 3% gain. Meanwhile, the so-called "Magnificent 7" stocks have soared by over 50%. Since the peak of this ratio in February 2023, the S&P 500 has seen an impressive ~29% increase compared to the equal-weighted index's modest 7% uptick.
Adding to the intrigue, the top 10% of US stocks now collectively command ~75% of the S&P 500, marking the highest concentration since the 1930s. Never has the market been so heavily influenced by such a select few names.
Conclusion
Investments should be carried in S&P 500 and one should increase the allocation keeping the long term horizon and positive impact of falling interest rates coming down.
The pressing question now looms: How sustainable is the dominance of the Magnificent 7 in driving the market's upward trajectory and how many more highs we will witness in 2024.


 CAclubindia

