The fast-paced trend of growth has always kept the companies in a constant spirit of competition and a fear of securing a market position.
This pressures the companies to keep a check on the financial statements and financial reporting.
What is financial statement fraud?
According to SA 240 (auditor's responsibilities Relating to frauds in the financial statements) Explains fraud as -
Financial Statement fraud is an intentional misstatement in order to deceive the readers of the statements. This might involve the management or the employees of the company.
Fraudulent reporting includes: Intentional Misstatements which includes omission of amounts or disclosures in financial reporting, misappropriation of assets under-reporting of liabilities and statutory dues. Misstatements in contingencies.

Why does fraud occur?
There are various reasons, but the most common reasons are:
- Pressure from management.
- To attract more investors.
- To Cover up significant internal control deficiencies.
The identification of fraud shall be difficult but not impossible.
SA 315 (Identifying and assessing the risks of material misstatement through understanding the entity and its environment.) auditors can apply various tools in detection of fraud and misstatements with professional skepticism.
What is the Beneish Model?
Beneish Model is a statistical model created by Professor Messod D.
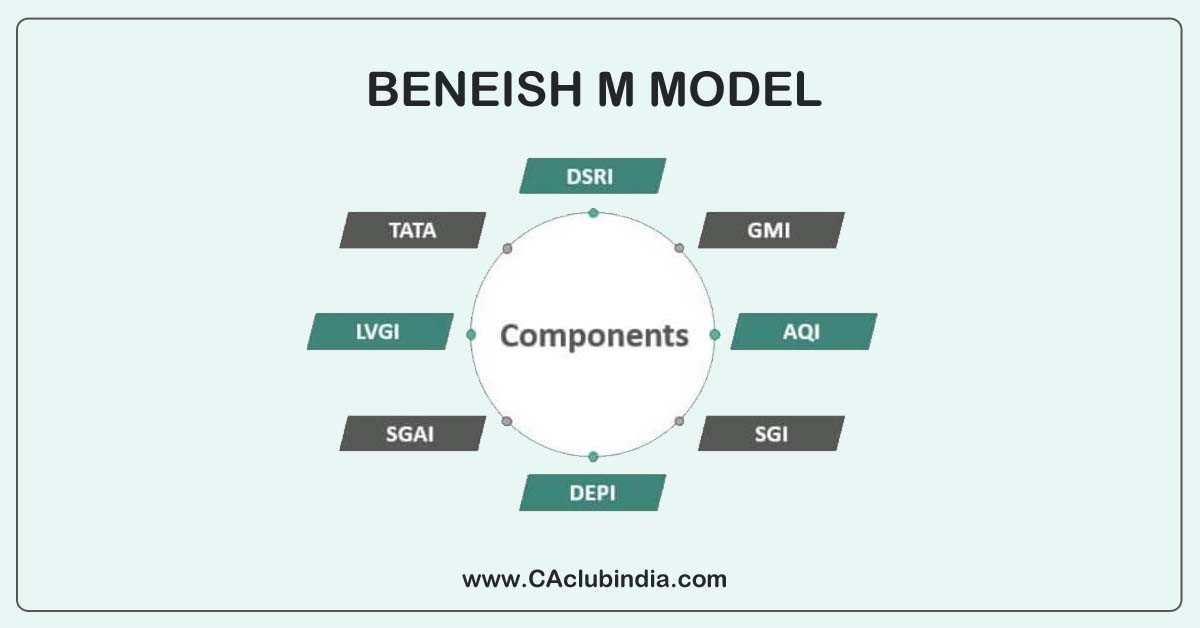
It is a model that studies the trend of the organisation through various ratios. This model is based on eight financial ratios.
The eight ratios are
- Days Sales in Receivables Index (Receivables / Sales * no of days) This helps in recognising any unreasonable change in the debtors compared to the previous years.
- Gross Margin Index (Sales- cost of sales/ sales) If Gross Margin Index is greater than 1, then this indicates organisation's gross margin has decreased and may be manipulative.
- Asset Quality Index {1-(current Assets + Net Fixed Assets/ Total Assets)}: This indicates the unnecessary costs that are capitalised which are not be capitalised.
- Sales Growth Index: (Sales of the current year/ sales of the previous year) Growth in sales as such does not indicate manipulation, however, companies with high growth rates find themselves highly motivated deceive when the trend reverses.
- Depreciation Index: (Depreciation/ Depreciation+Net assets): Depreciation index lower than 1 shows an inappropriate increase in the useful life of fixed assets.
- SGA Index: (Sales, General, Administrative Expense/ Sales): This reflects the manipulation of expenses like sales, general and administrative with sales ratio.
- Leverage Index: (Total Debts/ total Assets): If the ratio is greater than 1, usually indicates new debt or increase in debts. Unusual Increase in debts hints manipulation.
- Accruals to total assets: (Change in WC - Change in Cash + Change in Income Tax payable + Change in Current portion of Long Term Debt- Depreciation/ Total Assets=TATA)
Higher the TATA higher the chances of manipulation.
How does this work?
All the above are combined together into calculated score called M Score:
The Formula is: -4.84 + 0.92*DSRI + 0.528*GMI + 0.404*AQI + 0.892*SGI + 0.115*DEPI - 0.172*SGAI + 4.679*TATA - 0.327*LVGI (note)
When to ascertain manipulation?
When the resultant is greater than -1.78 then the chances of manipulation is higher, less that -1.78 indicates less manipulation.
Thus this model helps both auditors and forensic accountants in detection of fraud and manipulation.
(Note: DSRI- Days Sales in receivable Index, GMI - Gross Margin Index, AQI- Asset Quality Index, SGI- Sales Growth Index, DEPI- Depreciation Index, SGAI- Sales, Genera, Administrative Index, TATA- Total assets, LVGI- Leverage Index)


 CAclubindia
